

Executive Summary: CEO Dashboard Intelligence
- The Signal vs. Noise Filter: A functional CEO dashboard must ignore “total users” or “social followers” in favor of leading indicators like Lead Velocity and Cash Runway.
- The 5-5-5 Framework: Organize your tracking into three pillars: Marketing, Operations, and Finance—limiting each to five high-impact metrics.
- Verification Protocol: Never trust a single source. Cross-reference CRM data with bank statements to ensure your CEO dashboard reflects realized revenue, not “estimated” platform wins.
- Decision Rights: Every metric on your sheet must have a “Red Line” threshold. If a number crosses that line, it triggers an immediate, pre-defined operational response.

The average founder is drowning in a “subjectivity quagmire” of data. You open your Shopify analytics, check your Stripe payouts, glance at your Facebook Ads Manager, and realize none of these numbers actually tell you if your business is healthy. You are likely tracking vanity metrics: numbers that make you feel busy but don’t drive a single decision.
To regain control, you need a Weekly CEO Dashboard that filters out the noise and highlights the 15 “Truth Metrics” that dictate your operational reality.
Why Your Current Metrics are Lying to You
Most reporting suites are designed by platform engineers, not operators. They show you “Engagement” because it keeps you on their platform. But as a CEO, engagement doesn’t pay for payroll. The “Standard SEO” approach to data often leads to a “checklist culture” where you see green lights across your software stack while your bank account stays stagnant.
A true CEO dashboard acts as an “Antifragile” shield. It isn’t just about showing growth; it’s about showing where you are vulnerable. If you are tracking 50 metrics, you are tracking nothing. We are going to strip that down to the 15 that actually move the needle.
The Marketing Pillar: Tracking Intent and Velocity
The biggest mistake in marketing tracking is focusing on volume over velocity. You don’t need “more traffic”; you need “more intent.”
- CPM (Cost Per Mille): Are your ads getting more expensive to show?
- CPC (Cost Per Click): Is your message still resonating with the market?
- Lead Velocity Rate: The percentage growth in qualified leads month-over-month.
- CAC (Customer Acquisition Cost): What is the fully loaded cost to acquire a customer today?
- Channel Mix %: Are you too dependent on one source (e.g., Meta or Google)?
In your Weekly CEO Dashboard, these numbers should tell you if your “Top of Funnel” is healthy or if your acquisition engine is starting to overheat.
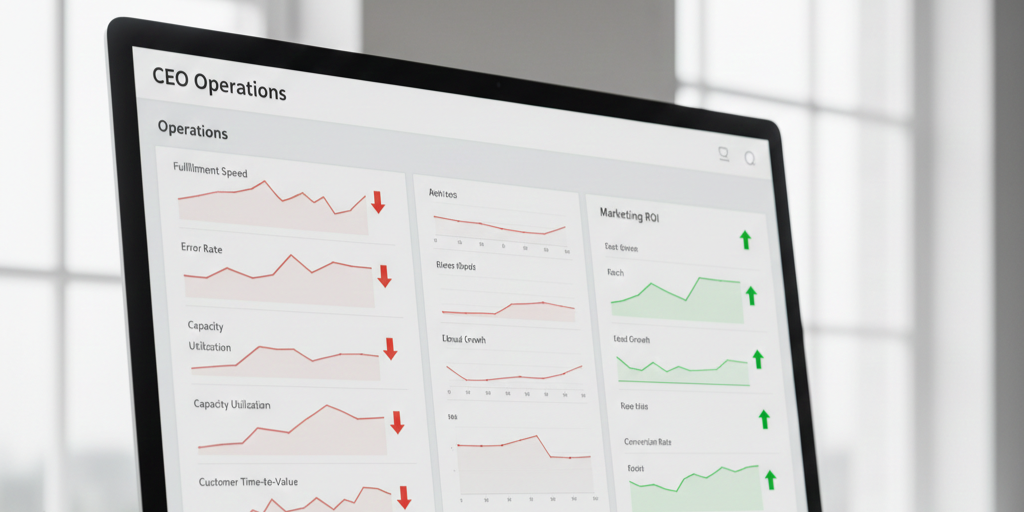
The Operations Pillar: Measuring Friction
Operations is where most $1M–$5M companies fail. They scale the marketing but break the delivery.
- Fulfillment Speed: How long from “Paid” to “Delivered”?
- Error Rate: What percentage of orders or projects require a “do-over”?
- Capacity Utilization: How much more work can your current team handle before you must hire?
- Net Promoter Score (NPS): Are your customers actually happy, or just quiet?
- Customer Time-to-Value: How fast does the customer get their first “win” after paying?
If these numbers on your CEO dashboard turn red while your marketing is green, stop spending. You have a “leaky bucket” problem, and scaling will only accelerate your collapse.
The Finance Pillar: The Hard Truths
This is the “Truth Source.” This is where you bridge the gap between “Marketing ROI” and “Realized Profit.”
- Cash on Hand: Exactly how much is in the bank right now.
- Monthly Burn Rate: What is the cost of staying alive?
- AR/AP Gap: The delta between when you pay your bills and when your customers pay you.
- Gross Margin per Product/Service: Are you actually profitable on a unit basis?
- Net Revenue Retention (NRR): How much are your existing customers spending compared to last year?
A CEO dashboard that ignores NRR is a dangerous tool. It costs 5x more to get a new customer than to keep an old one. If your NRR is under 100%, you are in a treadmill business, not a growth business.
The “Red Line” Severity Matrix
A number without a threshold is just a distraction. For every metric on your Weekly CEO Dashboard, you must define three levels of response:
- Level 1 (Notice): A 10% variance from the target. The department head investigates.
- Level 2 (Monitor): Two consecutive weeks of decline. A written explanation is required in the weekly pre-read.
- Level 3 (Emergency): The metric hits the “Floor.” All other projects stop until this bottleneck is cleared.
Here is the Script: The Weekly Sync
“I’ve reviewed the CEO dashboard pre-read. The AR/AP gap has widened by 15% for the second week. We aren’t discussing new hires today until we identify why our collection cycle is slowing down. Who is the DRI on this, and what is the fix?”
The Verification Protocol: Trust, But Verify
Data is only as good as its source. We’ve seen founders make $100k mistakes because their CEO dashboard was pulling “Estimated Revenue” from a Facebook Pixel that was double-counting conversions.
Every Sunday night, your Ops lead should bridge the numbers. If the CRM says you did $50k in sales, but Stripe only shows $42k, that $8k discrepancy is your most important metric. Don’t build your CEO dashboard on “hopes and dreams” data; build it on reconciled bank statements.
Final Word
The transition from “Founder” to “CEO” happens the moment you stop managing people and start managing systems. Your CEO dashboard is the control panel for those systems. By focusing on 15 high-leverage metrics across Marketing, Operations, and Finance, you eliminate the cognitive load of data-overload and gain the clarity needed to scale.
Stop looking for “more data” and start looking for the “Truth Metrics” that tell you exactly where your business is breaking. Build your Weekly CEO Dashboard today, set your Red Lines, and finally start leading with certainty.
FAQ: CEO Dashboard
How often should I check my CEO dashboard?
Check it once a week. Daily monitoring leads to “ticker-watching” and reactive decision-making rather than spotting long-term operational trends.
What is the best tool for a Weekly CEO Dashboard?
Start with Google Sheets. It is harder to hide “fluff” in a spreadsheet than in complex software, making your CEO dashboard more transparent and easier to audit.
Should I share the CEO dashboard with the whole team?
Share Marketing and Ops pillars to align the team. Keep the Finance pillar (cash and burn) for the executive level to prevent unnecessary panic or distraction.
What if my team refuses to update the metrics?
Make it a non-negotiable condition of employment. If a department head cannot report to the CEO dashboard, they aren’t managing, they are just observing.
How do I choose which metrics to add?
Use the “Decision Test.” If a 20% drop in a number wouldn’t force you to change your behavior or firing priority, it doesn’t belong on your CEO dashboard.
What is the most common mistake?
Trusting unverified platform data. Always bridge your CEO dashboard numbers to your bank statements to ensure you are looking at realized cash, not “estimated” wins.
How many metrics are too many?
Limit it to 15–20. If your CEO dashboard requires more than five minutes to scan and interpret, it has become a report rather than a decision-support tool.